

The Data-Driven Shift in Learning
Years ago, learning management systems (LMS) served largely as digital shelves: repositories of videos, documents, quizzes, and discussion boards. Learners logged in, consumed content, submitted assignments, and (hopefully) moved on. But that model treated learning as a passive transaction. Today, the story is very different. The transformation toward using data analytics in LMS has shifted e-learning from mere content delivery to insight-driven, tailor-made learning journeys.
Today, every click, every quiz, every discussion post, and every pause carries meaning. These interactions become data points. In aggregate, they reveal patterns: where learners struggle, when they disengage, and how long they persist. Leading institutions no longer rely solely on end-of-term evaluations or instructor impressions. They lean on learning analytics to understand the process as it unfolds.
Read more: Data Analytics in E-Learning: What You Need to Know
That shift is not theoretical. According to eLearning Industry, over 80 % of organisations now use learning analytics to measure learner impact and engagement. These analytics are no longer optional add-ons; they are central to how we design, monitor, and refine learning programs. By harnessing data analytics in LMS, platforms can monitor trajectories, intervene early, and personalise the learning path. At Vigilearn, our EdiifyLMS is built with these guiding principles. It captures LMS data insights at every stage, from initial engagement through diagnosis of learning gaps to next-step recommendations. In other words, EdiifyLMS turns every interaction into measurable progress.
The Key Metrics That Define Learner Success


To understand how data analytics in LMS boosts outcomes, we must first examine what metrics matter. Not all data are equally useful. The power lies in focusing on metrics that correlate strongly with learner progress, retention, and effectiveness.
Engagement Metrics
Engagement metrics form the foundational layer. They include:
- Active participation: how often learners access the LMS, log in per week, and modules accessed.
- Time spent on lessons: duration of sessions, time per page or activity.
- Discussion activity: forum posts, replies, peer interaction.
- Session frequency: consistency of login behaviour (daily, weekly, sporadic).
These metrics matter because research supports their predictive power. For example, in studies of LMS data and student outcomes, low engagement strongly correlates with poor grades and higher dropout rates. A university utilised a retention analytics dashboard that combined activity, assignments, and grades to identify at-risk learners. Engagement measures offer early warning signals long before formal assessments.
Performance Metrics
Beyond engagement, you track how well learners are performing:
- Quiz and test scores: raw and normalised.
- Assessment trends: improvements or declines over time.
- Course completion rates: how many starts vs finish, and how quickly.
- Assignment submission behaviour: late or missing submissions, number of resubmissions.
- Skill mastery levels: scores by topic or module concentration.
These performance metrics allow administrators to detect which learners are excelling and which are struggling. Combined with engagement data, you can spot divergence: a learner may log in frequently but consistently perform poorly in assessments, which suggests deeper conceptual gaps.
Predictive Metrics
The greatest value of data analytics in LMS comes when you move from descriptive to predictive. Predictive metrics attempt to forecast future performance, dropout risk, or retention likelihood. These might include:
- Probability scores: risk indices that estimate the chance a learner will not complete.
- Trajectory clusters: grouping learners with similar patterns to foresee outcomes.
- Alert thresholds: triggers based on falling below engagement or performance benchmarks.
- At-risk flags: built by machine learning models to signal early intervention.
Institutions like Crown College used predictive analytics to increase retention: their model forecast at-risk students, enabling strategic interventions. The field continues to mature. In one study, machine learning models predicted dropout with up to 88 % accuracy using both behavioural and demographic data.
With predictive metrics, administrators no longer wait for a midterm failure. They can identify early signs of disengagement or downward trends and intervene proactively.
Acting on Metrics: Proactive Measures
Counting metrics is not enough. The true benefit lies when administrators use them to act. Suppose a learner’s login frequency falls, time per module shrinks, or quiz scores begin to dip. An early alert can prompt outreach: personalised emails, nudges, tutoring offers, extra resources, or customised reinforcements. Because learning analytics delivers continuous insight, interventions can be timely, targeted, and far more effective than reactive remediation.
How Vigilearn Integrates Data Analytics into EdiifyLMS
At Vigilearn, we see analytics not as an add-on but as the core of intelligent learning design. EdiifyLMS is engineered to surface meaningful insights at every level: learner, instructor, and organisational. Below is how we deliver LMS data insights in practice.
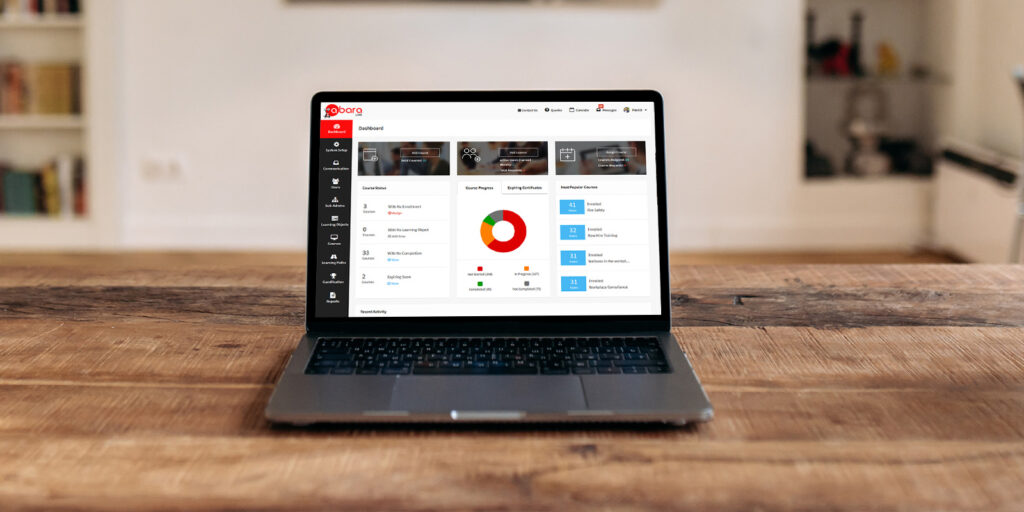
Custom Dashboards for Insightful Visibility
EdiifyLMS provides dashboards tailored to different stakeholders:
- Learner dashboards: each learner sees their progress, assessment trends, gaps to focus on, and recommended next steps.
- Instructor dashboards: instructors monitor class cohorts, identify learners lagging, and visualise difficulty nodes in the content.
- Admin dashboards: program administrators view overall course efficiency, average completion times, dropout points, and instructor effectiveness.
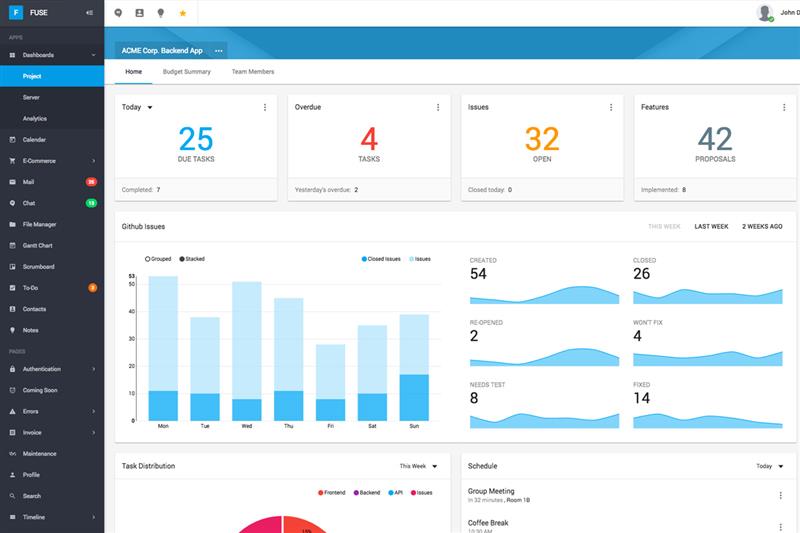
These dashboards convert raw data into visual, actionable insights. They highlight trends, anomalies, and areas needing attention, not raw tables of numbers.
Automated Reporting and Export Tools
For institutional teams, EdiifyLMS automates reporting. Trainers or administrators can export success summaries, performance charts, cohort comparisons, and completion breakdowns in formats like PDF, Excel, or PowerPoint. These reports can be generated on schedule or on demand, enabling evidence-based decision-making without manual effort.
By automating time-intensive reporting, administrators free themselves to analyse insights rather than compile data.
If you wish to explore EdiifyLMS features in action, check out the EdiifyLMS platform or see modules for schools and for businesses.
Real-World Impact: Case Studies
The strength of data analytics in LMS is best judged by the people who use the systems and by the measurable shifts those systems enable. Here’s how EdiifyLMS has made a difference in real settings, combining qualitative insight with evidence-backed context.
Empowering Institutions with Measurable Insight
At Babcock University’s Centre for Open Distance and e-Learning (BUCODeL), the move to data-driven teaching is no experiment; it’s a daily practice. EdiifyLMS gives faculty visibility into student patterns, module usage, and performance trends. That visibility helps them adjust in real time rather than waiting for end-of-term feedback.
As Prof. Mobolanle S., Director of BUCODeL, puts it:
“EdiifyLMS caters for all we need for teaching, learning and engaging in an educational setting. You can’t quantify the thoughts that have gone into building the platform and more than that… the responsiveness to flexibility to suit needed purposes is awesome.”
With analytics in place, the faculty can monitor which modules see drop-offs, which assessments yield low scores, and which learners lag.
Elevating Engagement and Accountability at ABU
At Ahmadu Bello University Distance Learning Centre (ABUDLC), Zaria, managing large online cohorts and multiple programs challenged traditional oversight. EdiifyLMS brought structure, transparency, and actionable metrics into the mix.
Dr. Usman A. Zaria, Deputy Director of Learner Support and IT, describes their transformation:
“The Ediify LMS is unquestionably an invaluable asset that has significantly enhanced interactions and engagement among students, tutors, and management. Its comprehensive metrics and user-friendly dashboards enable the measurement of tutors’ and students’ online performance. This feature ensures the seamless and effective delivery of lectures, contributing to a highly efficient learning experience.”
By combining learning analytics with adaptive learning tools, ABU now tracks student participation, tutor behaviour, and content effectiveness from one dashboard. Engagement dips or performance declines register as alerts, enabling proactive support rather than reactive fixing.
That capability aligns with documented success in academic settings. For instance, a study on targeted analytics found that identifying disengaged students and offering timely outreach improved retention by around 6 percentage points.
Outcomes in Education and Corporate Spaces
While university settings clearly benefit, corporate clients also gain from data analytics in LMS. One of Vigilearn’s corporate clients experienced a 35 % boost in employee certification rates after deploying EdiifyLMS. Because the system tracks engagement, assessment performance, and predictive risk, the organisation could flag learners at risk of dropping out, provide personalised support, and maintain momentum throughout the program.
These improvements reflect patterns seen across the industry. According to eLearning Industry, companies that use LMS analytics to optimise training often see higher course completion and better learning ROI.
The Future: Predictive and AI-Enhanced Learning Analytics
We have only scratched the surface. The future of data analytics in LMS lies in deeper AI, real-time feedback loops, and more nuanced insight. Here are the trends shaping what lies ahead.
Deeper Predictive and Machine Learning Models
Today’s predictive metrics rely on statistical models. Tomorrow’s models will incorporate more variables: social interaction, sentiment analysis, engagement rhythms, and even affective data (emotions). Recent research has already begun exploring how behavioural engagement features strongly predict retention. Later models may be able to forecast not only dropout risk, but optimal intervention strategies customised per learner.
Sentiment Tracking and Affective Analytics
Emerging metrics will consider learners’ emotional states. Through natural language processing (NLP) on discussion posts, sentiment tracking can detect frustration, confusion, or disengagement. This adds context: a learner whose test scores remain constant but whose tone becomes negative may need support. Integrating those signals with other analytics can yield richer, proactive paths.
Real-Time Feedback Loops and Microadaptive Learning
Imagine an LMS that responds instantly. A learner struggles with a question: the system pauses and injects a targeted micro-lesson or hint. Another scenario: in a video, a learner replaying a section repeatedly triggers the system to offer supplementary diagrams or alternate media.
These real-time feedback loops blur the line between learner and analyst. The system becomes a tutor responding dynamically to each action. Over time, this becomes a fully adaptive learning journey.
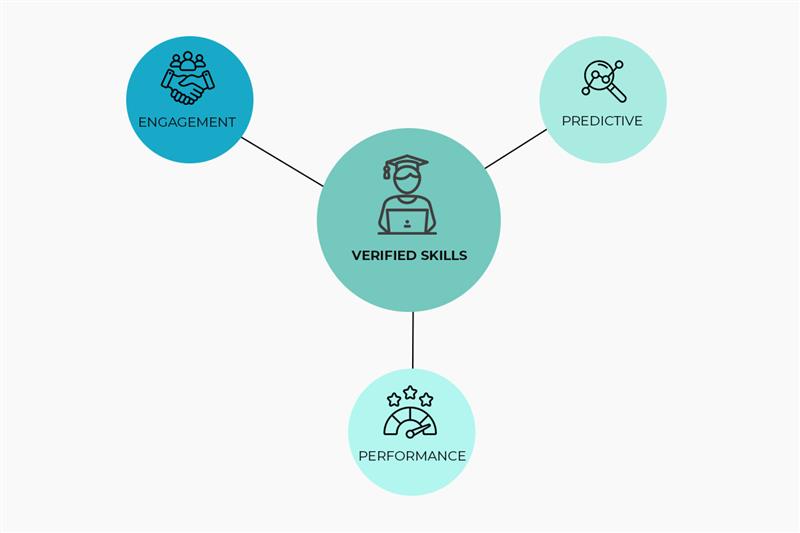
Skill Validation and Microcredentials Informed by Analytics
Analytics can also power microcredentials and skill badges. Completion of learning pathways backed by performance data can result in validated credentials. Analytics ensure that awarding credentials is not arbitrary but based on solid data: sustained engagement, mastery, and improvement.
Predictive Course Design and Content Optimisation
Beyond individual learners, platforms will analyse which course modules lead to drop-off or which content types result in mastery. LMSs will automatically reconfigure learning sequences, eliminate ineffective content, and prioritise the most impactful modules. This closes the loop: analytics not only drive intervention but also content evolution.
From Data to Development
The shift toward data analytics in LMS marks a turning point in education. It transforms learning from reactive to proactive, from one-size-fits-all to adaptive and individual. Institutions that ignore this shift will miss critical opportunities to improve learner success.
At Vigilearn, we believe the future of learning is intelligent. Our EdiifyLMS is built to harness LMS data insights, learning analytics, and adaptive learning tools to boost learner engagement, retention, and performance.
If you’re ready to see how data can personalise education, measure what matters, and elevate outcomes, request a demo today.