


Gone are the days when the success of a school is judged solely by test scores or graduation rates; it’s increasingly measured by how well educators understand and respond to student progress in real time. For schools, teachers, and administrators, student progress analytics tools are essential technologies for monitoring performance, identifying learning gaps, and shaping strategies that truly support every learner.
What Are Student Progress Analytics Tools?
At their core, student progress analytics tools are digital solutions that collect, process, and display data on student activity and achievement. Think of them as intelligent dashboards or smart mirrors; they reflect not only where a student currently stands, but also where they are heading.
These tools often feature:
- Dashboards that give real-time snapshots of class-wide and individual performance.
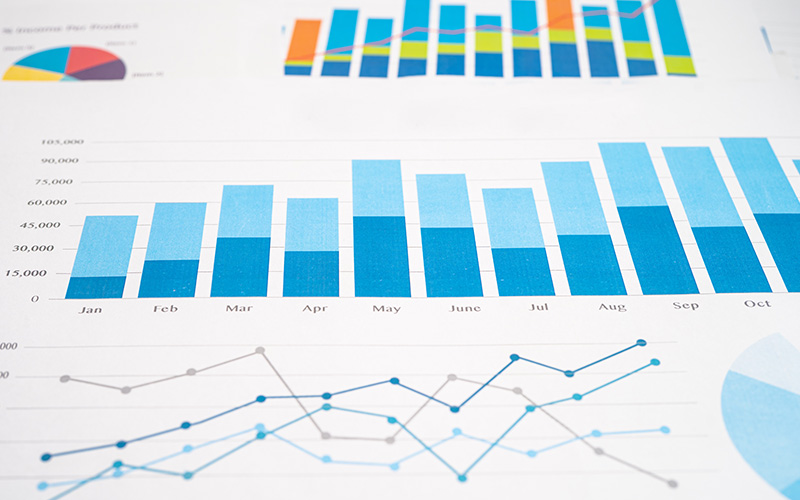
- Visual reports that translate test scores, participation data, and assignment submissions into easy-to-read graphs.
- Predictive metrics that flag students at risk of falling behind before they do.
For teachers, this means better lesson planning. For administrators, it means improved oversight and decision-making. And for students, it means timely support and a learning experience that adjusts to their needs.
Why Tracking Student Progress Matters

The ability to track student progress accurately and consistently has profound implications for learning outcomes. Here are a few reasons why this matters now more than ever:
1. Detect Struggling Students Early
A decline in assignment submissions, poor quiz scores, or inconsistent login, analytics tools can pick up on subtle patterns that often go unnoticed in traditional classrooms.
2. Enable Personalised Intervention Strategies
When you understand where and why a student is struggling, you can tailor your approach. Whether it’s assigning remedial content or modifying the pace of instruction, analytics tools empower educators to personalise learning at scale.
3. Improve Course Completion and Satisfaction
When students feel supported and see their progress, motivation improves. Institutions using advanced LMS analytics often experience higher course completion rates compared to those without integrated data tools.
Key Features to Look For in Student Progress Analytics Tools
Not all analytics tools are created equal. When choosing a platform for your school, here are the must-have features that make tracking more effective and actionable:

- Real-Time Dashboards
Dashboards should offer live insights into learner engagement, assessment performance, attendance, and participation. Ideally, these dashboards should be customizable and filterable by class, subject, or student.
- Benchmarking and Trend Analysis
Educators benefit from historical comparisons, how a student is performing compared to last month or the term before. Benchmarking features allow schools to spot long-term patterns and measure progress against curriculum goals or standardised expectations.
- Automated Alerts
Timely alerts can make a difference between proactive intervention and reactive measures. Look for tools that automatically notify teachers or admins when a student’s performance drops below a set threshold.
- Integration with LMS and SIS
Analytics tools should integrate seamlessly with your Learning Management System (LMS) and Student Information System (SIS). This ensures that all relevant data grades, login activity, participation, and assessments flow into one unified view.
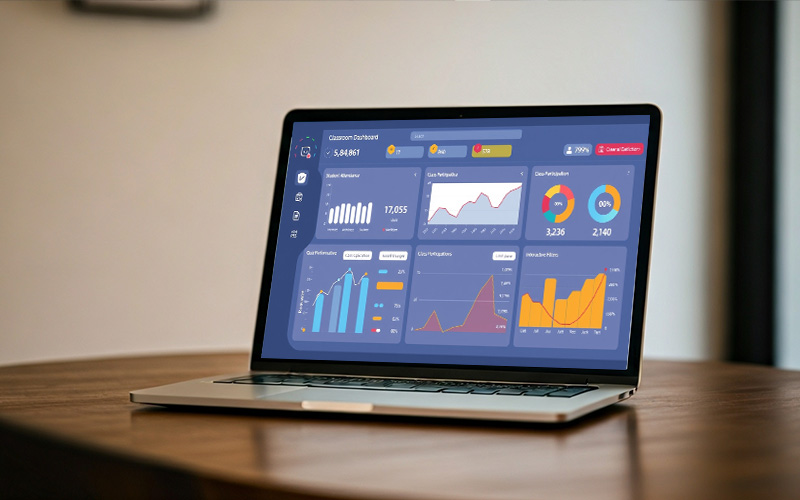
How Vigilearn’s Analytics Tools Work
At Vigilearn, we believe that tracking student progress shouldn’t be complicated; it should be insightful, efficient, and actionable. That’s why our analytics tools are deeply embedded within the Vigilearn ecosystem, integrating both EdiifyLMS and Enroli SIS to provide a 360-degree view of student progress.
Dashboard Views
Our intuitive dashboards show real-time indicators such as:
- Assignment completion rates
- Quiz performance trends
- Attendance and login frequency
Teachers can drill down to individual student profiles or view class-wide summaries.
Reporting & Custom Alerts
Vigilearn allows educators to generate reports by subject, class, or cohort, export data for further analysis, and set custom alerts that notify stakeholders when students hit predefined risk triggers.
Predictive Insights
Through historical data and machine learning models, our tools can predict learning bottlenecks and suggest proactive support strategies, whether it’s extra tutorials, revision exercises, or content pacing adjustments.
Seamless Integration
Because Vigilearn’s analytics tools are embedded within the same platform that powers your learning and administration EdiifyLMS and Enroli SIS you don’t have to worry about data silos or integration gaps. You get full, frictionless visibility into student behaviour, academic records, and participation patterns.
Explore more about Vigilearn’s LMS analytics on our homepage or contact us to request a demo.
Use Cases: Data‑Driven Teaching in Action
Analytics tools can transform teaching into a more targeted, impactful experience. Here’s how some of our partner schools have made it work:
Tailoring Lesson Plans
Using real-time insights, teachers at a Lagos-based secondary school adjusted their weekly lesson plans based on students’ quiz scores and reading times. Topics that had low comprehension scores were revisited the following week, resulting in improved retention and engagement.
Adaptive Assessments
With performance trends at their fingertips, educators began to offer different levels of quizzes basic, intermediate, and advanced based on individual progress. Students responded positively, showing improved confidence and better test outcomes.
Transparent Parent-Teacher Communication
Analytics dashboards helped administrators generate visual performance summaries that could be shared during parent-teacher meetings. Instead of vague progress reports, parents now receive data-backed insights into their child’s learning journey.
Best Practices for Using Data in Schools
The most effective student progress tracking isn’t just about tools, it’s about how you use them. Here are a few tips for making the most of your analytics:
1. Set SMART Goals
Start with Specific, Measurable, Achievable, Relevant, and Time-bound goals. Whether it’s “improve math comprehension by 15% over the next term” or “identify all students at risk of failing by midterm,” clarity leads to impact.
2. Conduct Regular Data Reviews
Set up monthly or bi-weekly check-ins with teaching staff to review data trends. Use these reviews to tweak lesson plans, reassign content, or discuss student interventions.
3. Involve the Whole Ecosystem
Great student outcomes require collaboration. Involve administrators, parents, counsellors, and even students themselves in understanding and acting on analytics insights.
4. Prioritise Data Privacy
Always ensure that analytics tools comply with data protection laws and best practices. Student data should be secure, anonymised when necessary, and used ethically.
Student progress analytics tools are no longer optional; they are foundational to modern education. With the right system in place, schools can improve learning outcomes, reduce dropout rates, and support educators in delivering more effective, data-informed instruction.
At Vigilearn, we’re proud to offer tools that not only simplify tracking but also enhance the entire teaching and learning experience. Ready to make smarter, data-backed decisions for your school?
Get in touch with us to learn how Vigilearn can power your student success.