
Your LMS has a login rate. But do you know the think rate, discuss rate, and return rate?
These are not abstract questions. They are the difference between an institution that understands its students and one that is quietly watching them leave. The online learning student disengagement cost does not begin when a student withdraws; it begins weeks earlier, in the gradual withdrawal of participation that most platforms register as nothing at all. A student who logs in and reads nothing has technically appeared in your engagement data. They have not engaged with learning. And if your institution is measuring LMS success primarily by login volume, you are not measuring engagement at all. You are measuring the size of a door that fewer and fewer students are walking through.
This matters more than it might initially appear. University leadership that suspects their LMS is being used less effectively than the access data suggests is almost certainly correct. The question is not whether disengagement is happening. Research, financial data, and institutional experience all confirm that it is. The question is whether your institution has the infrastructure to see it, act on it, and prevent it from becoming a dropout.
Read More: How to Improve Virtual Classroom Engagement
What the Global Data Says About Online Learning Completion
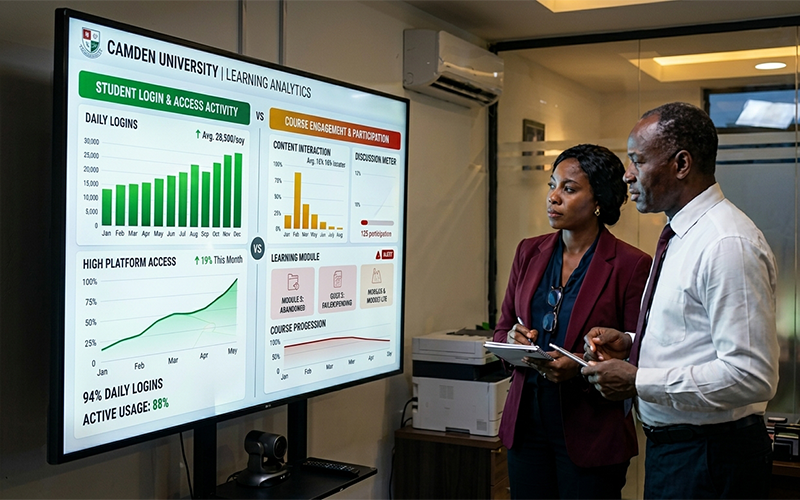
The completion data for online learning is consistent, well-documented, and should be uncomfortable reading for any institution that has moved significantly toward digital delivery without investing in engagement infrastructure.
Research by Jordan, widely cited across learning analytics literature, found MOOC completion rates with a median of 12.6%, ranging from 0.7% to 52.1% across different course types. Separate research confirms that only 5% to 15% of students registered for online courses complete them without structured accountability mechanisms in place. At the institutional level, the picture is only modestly better: 23.3% of full-time undergraduates in the United States leave without completing their degree, and for part-time students, the dropout rate exceeds 55%.
Several patterns emerge consistently across geographies, institution types, and subject areas:
- Disengagement begins early. Research consistently identifies the first and second weeks of a course as critical for establishing engagement patterns, with students who do not establish active habits in this window significantly more likely to disengage over time.
- Social isolation drives dropout. Research published in Springer’s Education and Information Technologies found that students who engage socially with peers are considerably more likely to complete online courses, with social learners accessing between 50% and 100% of course steps versus 9% to 46% for non-social learners.
- LMS behaviour predicts dropout weeks in advance. Studies analysing LMS log data confirm that login frequency, assignment submission patterns, forum participation, and content interaction rates are reliable early indicators of dropout risk, detectable well before a student formally withdraws.
The online learning student disengagement cost starts as a data problem. Students leave signals in your LMS every time they interact, or fail to. The question is whether your platform is designed to read them.
Translating Dropout Into Financial Loss

The engagement problem becomes a financial crisis when scaled across an institution. Consider the numbers plainly.
According to the National Student Clearinghouse Research Centre, four-year institutions lose an average of $21,000 per dropout in tuition and fees. For a university running an online programme with 3,000 enrolled students and an 18% first-year dropout rate, that represents 540 students not returning. At even conservative fee levels of $3,000 per year, the institution absorbs $1.62 million in lost annual revenue. At higher fee levels, the figure scales dramatically.
Universities globally lose billions of dollars annually in tuition revenue, while also incurring the reputational damage that makes future recruitment more expensive. The acquisition cost for each student who does not return is entirely unrecoverable: marketing spend, admissions staff time, onboarding resources, and any institutional support deployed in the first weeks. None of it converts into retained revenue when the student withdraws.
A 5% improvement in retention is not only an academic welfare achievement. It is a meaningful revenue recovery that also reduces the per-student cost of support for the students who remain. The institutions treating retention as both a student outcome and a financial metric are the ones investing deliberately in the infrastructure that makes it possible. Every student who stays is a student whose acquisition cost has converted into sustained revenue.
Why Most LMS Platforms Are Built for Content Delivery, Not Engagement
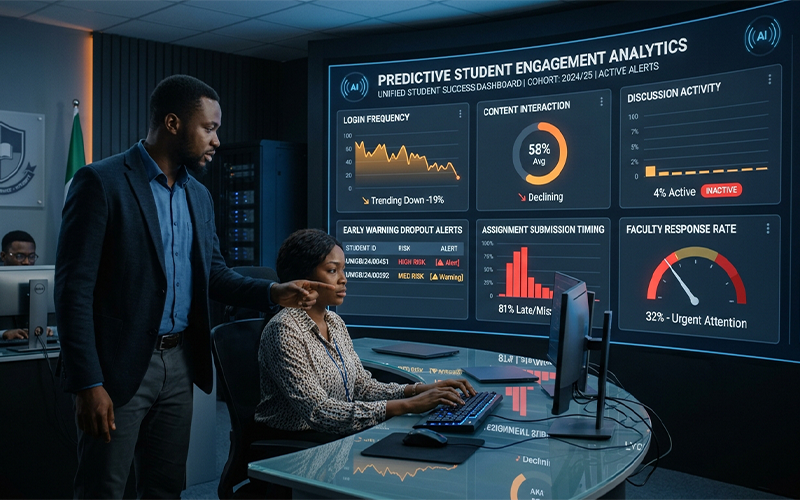
Here is the distinction that tends to be absent from LMS procurement conversations, and it is the one that explains most of the online learning student disengagement cost that institutions are currently absorbing without fully understanding.
A content delivery LMS provides a structured location where faculty upload materials and students access them. This is a solved problem. Materials are available, searchable, and consistently distributed. The limitation is that this architecture is passive and one-directional. It registers access. It does not register understanding, participation, connection, or the gradual withdrawal that precedes dropout.
An engagement platform does something fundamentally different. It tracks how students interact with content, not just whether they opened it. It surfaces declining engagement patterns before they become dropouts. It creates friction-free pathways for peer interaction and faculty communication. It sends automated prompts when a student’s behaviour changes in ways that signal risk.
The critical operational question for any institution currently reviewing its LMS data with concern: when a student stops engaging with your online courses, how long does your institution currently take to notice? If the honest answer is weeks, or after a missed assignment, or when they formally withdraw, then the platform is functioning as a content repository. It is not functioning as an engagement infrastructure. That gap is where the online learning student disengagement cost becomes institutional cost.
Read More: The Digital Campus Is Not the Future. It’s What Your Students Are Already Expecting Today
The Engagement Signals Every Institution Should Be Tracking

The data points that reliably predict dropout risk are not complex. They do not require sophisticated analytics expertise to interpret. They require a platform designed to surface them automatically, consistently, and in time to act.
The signals that matter are:
- Login frequency change: a student who was logging in daily and drops to weekly or less is showing an early behavioural shift. Most platforms log this; few surface it automatically as a risk flag.
- Content interaction rate: accessing a course page without clicking on any materials, videos, or resources indicates passive presence rather than active engagement.
- Peer interaction absence: research consistently shows that students with zero peer interaction are significantly more likely to disengage and drop out. Discussion board silence is a measurable risk indicator.
- Assignment submission latency: submissions arriving later and later within the allowed window indicate increasing disengagement with the course structure.
- Response rate to faculty communication: declining response rates to tutor messages are one of the clearest behavioural signals available in LMS data.
Studies using LMS log data have demonstrated that these behavioural signals, including login frequency, content access, assignment submissions, forum participation, and time spent on the platform, can reliably predict dropout risk well before it occurs. Predictive models built on this data have achieved accuracy rates above 90% in identifying at-risk students. The constraint is not the data. It is whether the platform is built to use it.
How Ediify LMS Is Built Around Engagement, Not Just Delivery
Ediify LMS is designed on the premise that the unsolved problem in online learning is not content distribution. That problem is solved. The unsolved problem is keeping students engaged long enough to complete what they started.
The platform reflects that premise in specific, practical ways. The engagement analytics dashboard gives administrators and faculty real-time visibility into individual and cohort engagement levels, so declining participation is visible before it becomes absence. Automated re-engagement alerts are configurable to flag specific behavioural patterns, triggering outreach precisely when it can still change the outcome. Discussion boards, collaborative assignments, and live session integration create multiple pathways for peer and faculty interaction that research consistently identifies as the strongest protective factor against dropout.
Critically, Ediify gives students visibility into their own engagement data. When students can see their own participation patterns, self-awareness and motivation both increase. The student who does not realise they have been passively scrolling rather than engaging has no prompt to change. The student who can see their engagement metrics declining has one.
For institutions serving students with limited connectivity, Ediify’s Radio Mode ensures that bandwidth constraints do not lead to disengagement by default. A student who cannot load a video is not disengaged; they are a student whose institution has not accounted for their context.
Ediify is not a content platform with engagement features appended. It is an engagement platform with content delivery built in. The architectural difference is not semantic; it changes what the system is designed to optimise for and what happens when a student starts to drift.
What Changes When Engagement Infrastructure Is in Place
The institutional consequences of genuine engagement infrastructure are straightforward, and they are directly connected to the financial and academic outcomes that leadership is accountable for.
Dropout risk is identified weeks before it becomes a dropout, when intervention is still meaningful. Faculty time is directed toward the students who most need support, rather than distributed uniformly or applied too late. The students who receive timely, relevant contact are those whose behaviour indicates they need it, not those who happened to email at the right moment. Retention improvements translate into recovered revenue: a 5% reduction in dropout rate across a 3,000-student online programme at $3,000 annual fees returns $450,000 in revenue that was otherwise being absorbed as loss.
Accreditation and compliance processes also improve. Engagement data provides demonstrable evidence of student participation and academic progress, the kind of documentation that accreditation bodies increasingly require. Institutions that have only login data are not positioned to demonstrate engagement in the depth that modern accreditation frameworks expect.
The LMS your institution uses is either generating an online learning student disengagement cost that you cannot see until it appears as a withdrawal notification, or surfacing engagement data that you can act on while there is still time to make a difference. The difference between those two platforms is the difference between reacting to dropout and preventing it.
Frequently Asked Questions
What is the average dropout rate for online university courses? Research places MOOC completion rates at a median of 12.6%, with broader online programmes seeing first-year dropout rates of 18 to 23% at many institutions. These figures vary by programme type, student population, and the quality of engagement infrastructure in place.
Why do students disengage from online learning platforms? The most consistent factors are social isolation, lack of early engagement habits, absence of peer interaction, and the failure of institutions to identify and respond to early disengagement signals. Platform design that prioritises content access over engagement also contributes significantly.
How can universities reduce LMS dropout rates? By tracking engagement signals rather than just access metrics, automating early warning systems, creating structured peer interaction pathways, and ensuring faculty have the data they need to intervene before disengagement becomes dropout.
What engagement data should universities track in their LMS? Login frequency trends, content interaction rate, peer discussion participation, assignment submission timing, and response rates to faculty communication. Together, these form a reliable early warning system.
What is the financial cost of student dropout for universities? Four-year institutions lose an average of $21,000 per dropout in tuition and fees. Across a cohort, this translates to millions in recoverable revenue for institutions that invest in effective retention infrastructure.
How is an engagement LMS different from a content delivery LMS? A content delivery LMS stores and distributes materials. An engagement LMS tracks how students interact with those materials, surfaces declining engagement automatically, and enables timely, targeted intervention. Ediify is designed as the latter.
Your LMS Already Has the Data. The Question Is What It Does With It.
Your LMS knows when students are logging out for the last time. The question is whether it tells you before they are gone.
See how Ediify is built around engagement, not just content delivery. Book a product demo and discover what your institution’s real engagement data looks like.