


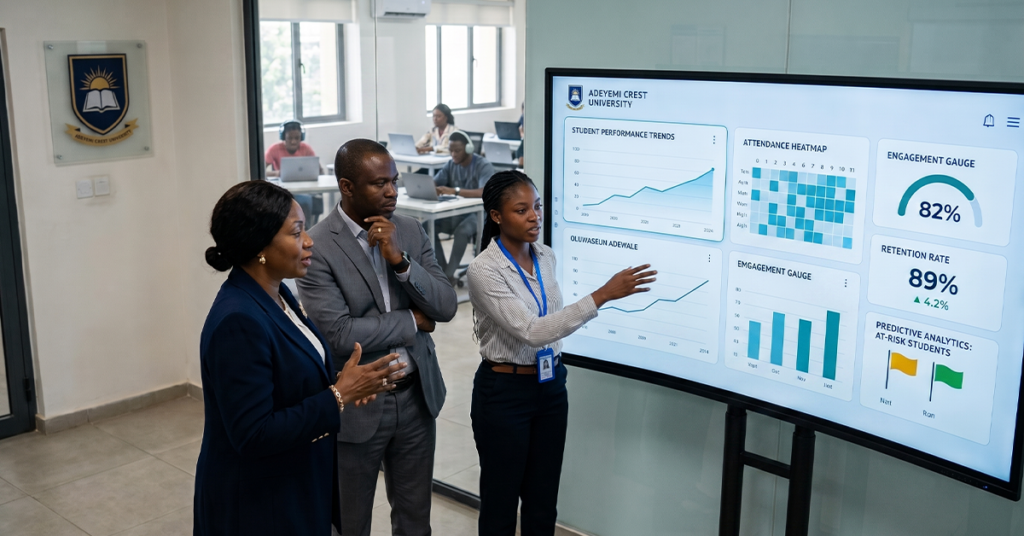
Every university runs on data, whether its leaders realise it or not. Every login to the learning management system, every attendance record, every assessment score and fee payment leaves a digital trace. Multiply that across thousands of students over several academic years, and you have one of the richest data sets any institution will ever hold. Yet ask most registrars what that data is telling them about student success, and the honest answer is often “not enough.” The information exists. The insight does not.
This is precisely the gap that learning analytics in higher education is designed to close. It is not another dashboard to glance at once a term, nor a compliance exercise for accreditation bodies. Done properly, it is the difference between discovering a student has failed out after the fact, and knowing weeks in advance that they were drifting off course and could still be reached. For institutions under pressure to improve retention, that difference matters enormously.
Read More: How Data Analytics in LMS Platforms Boost Learner Success Rates
Why Universities Are Sitting on a Goldmine of Student Data
The growth of digital learning has quietly turned every university into a data-generating organisation. Student Information Systems hold admissions history, enrolment, fee status and academic records. Learning management systems capture logins, time on task, assignment submissions and discussion participation. Attendance systems and assessment platforms add further behavioural detail.
The trouble is that most of this information sits in silos. A 2023 EDUCAUSE-referenced analysis found that a large majority of institutions struggle with data fragmentation, making it difficult to generate the cross-departmental insight that drives action. A registrar’s office might know a student has stopped paying fees, while the academic department has no idea the same student has stopped submitting coursework. Nobody joins the dots until the student has already withdrawn. Collecting data has never been the hard part; turning it into a coherent, timely picture of student progress is where most institutions fall short, and that is exactly the discipline learning analytics exists to provide.
What Is Learning Analytics in Higher Education?
Put simply, learning analytics in higher education is the practice of measuring, collecting, analysing and reporting data about students and their learning environments, with the goal of understanding and improving learning and the contexts in which it happens. The idea was formalised more than a decade ago by researchers who described it as a way of penetrating the fog surrounding how students actually learn, rather than relying on end-of-term grades alone.
In practice, it blends data visualisation, so engagement patterns and academic risk are visible at a glance, with student engagement measurement drawn from LMS activity and attendance, and what is often called academic intelligence: the synthesis of scattered data points into one usable signal. The result is decision support, not just reporting.
It is worth being precise about that distinction. Reporting tells you what happened last term: pass rates, attendance percentages, completion figures. Analytics asks why those numbers look that way and what is likely to happen next if nothing changes. A dashboard that only displays historical figures is a reporting tool. A system that flags a first-year student as being at elevated risk of withdrawal, based on attendance, assessment performance and LMS engagement together, is doing analytics. The EDUCAUSE Library’s collection on learning analytics makes this same point repeatedly: the value lies not in the volume of data collected but in the decisions it enables.
The Four Types of Learning Analytics in Higher Education

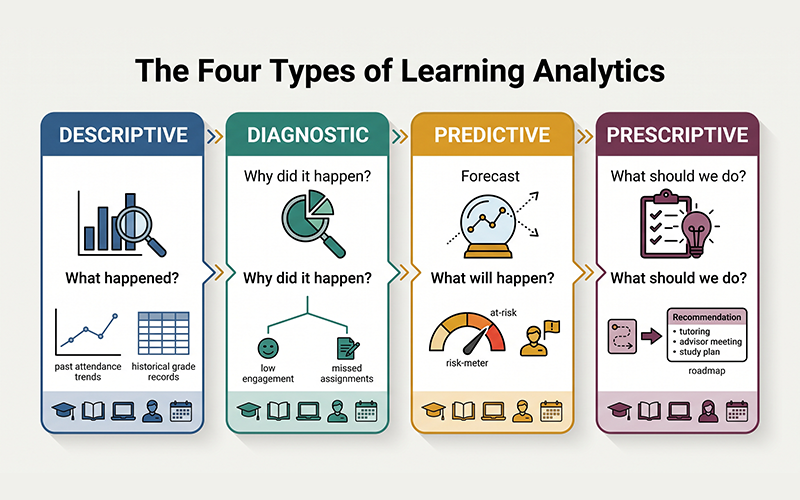
Most mature analytics strategies move through four stages, each building on the one before it.
Descriptive analytics answers “what happened?”: attendance rates by cohort, average grades by module, enrolment by programme. A university might use it to confirm that first-year retention in engineering fell three percentage points last year.
Diagnostic analytics answers “why did it happen?”, digging into those figures for causes. It might reveal the drop was concentrated among students who struggled with one gateway module, or those with lower LMS engagement outside peak hours.
Predictive analytics answers “what will likely happen?” This is where predictive analytics in higher education earns its reputation as the most consequential of the four, combining historical performance with real-time engagement to forecast which enrolled students risk failing or withdrawing, often weeks before an adviser would notice.
Prescriptive analytics answers “what should we do about it?”, moving from forecast to recommendation: referring a student to academic support, redesigning a module, or adding tutoring capacity where failure rates run high.
The clearest illustration of this progression remains Georgia State University. After introducing a predictive analytics system tracking more than 800 risk indicators daily, it raised its six-year graduation rate from 32 per cent in 2003 to more than 54 per cent by 2017, according to reporting in The Chronicle of Higher Education. Crucially, the gains were not confined to a privileged subset of students. Georgia State’s own student success data shows the institution has effectively closed graduation-rate gaps tied to race, ethnicity and income, a result it attributes to earlier, better-targeted intervention.
How Learning Analytics Improves Student Outcomes
The Georgia State example points to a broader pattern: institutions that treat student data analytics as a core operational discipline, rather than an IT project, see measurable gains across several fronts.
Early intervention is the most direct benefit. When advisers are alerted the moment a student misses a deadline or shows a sustained drop in LMS logins, they can reach out before a minor lapse becomes an unrecoverable one, and retention improves as a result, since most withdrawals follow weeks of quiet disengagement rather than one dramatic event.
Personalised learning also becomes possible once learning outcomes data exists at the individual level: a student struggling with a topic can be directed to targeted resources rather than repeating a whole module. Faculty decision-making sharpens too, as lecturers who see which concepts are causing widespread difficulty can adjust their teaching within the term.
Course improvement follows the same logic structurally. If diagnostic analytics repeatedly flags one gateway module as a bottleneck, that is a signal to redesign it, not to accept a stable failure rate as inevitable. Graduation rates, the figure most scrutinised by boards and prospective students, respond to the cumulative effect of all of the above.
Read More: Top Student Progress Analytics Tools for Educators
Building an Institutional Analytics Dashboard
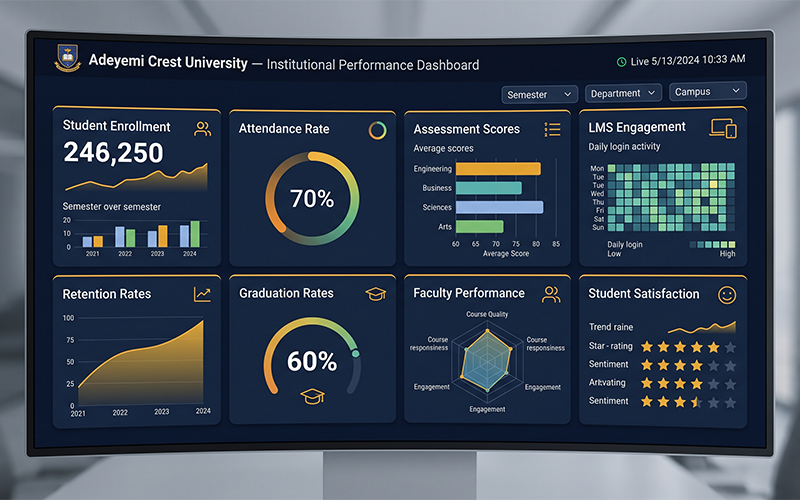
An effective academic performance dashboard need not display everything an institution measures. It needs to surface indicators that leadership and staff can act on immediately, typically:
- Enrolment and admissions conversion, tracking how many applicants become confirmed, active students
- Attendance and engagement, both physical attendance and LMS activity such as logins and content views
- Assessment scores, at module and cohort level, to spot patterns before final grades are issued
- Completion and retention rates, disaggregated by programme, year group and demographic where appropriate
- Student satisfaction, gathered through structured feedback rather than informal impressions
- Faculty performance indicators, such as marking turnaround and student outcomes by teaching group
A well-built executive dashboard might present one view for a provost: retention this term against the same point last year, a shortlist of high-risk modules, and a rolling count of students receiving intervention. That turns a university analytics platform into something a non-technical leader can act on in a single meeting.
Why Integrated LMS and SIS Data Creates Better Insights
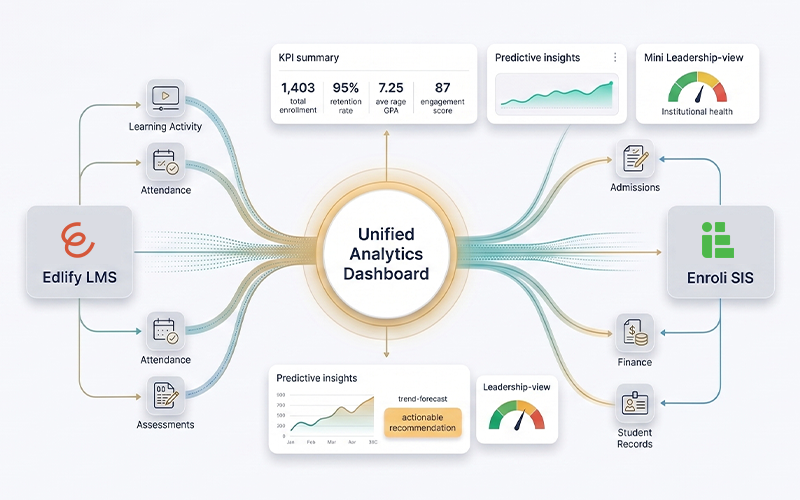
Analytics is only as good as the data feeding it, and integration is the real differentiator. A learning management system such as Ediify LMS captures the behavioural side of the student journey: engagement, consistency, assessment performance. A student information system such as Enroli SIS holds the administrative backbone: admissions history, enrolment status and fee records.
Neither tells the full story alone. Attendance data without fee context can misread a struggling international student as disengaged, when the real issue is a funding delay. Enrolment data without learning behaviour offers no early warning at all; by the time a registrar notices, the student has often already withdrawn. When the two are connected, as within Vigilearn’s LMS and eLearning solutions and Enroli SIS, institutions gain a genuinely unified view of each student, from application through to graduation.
Future Trends in Learning Analytics
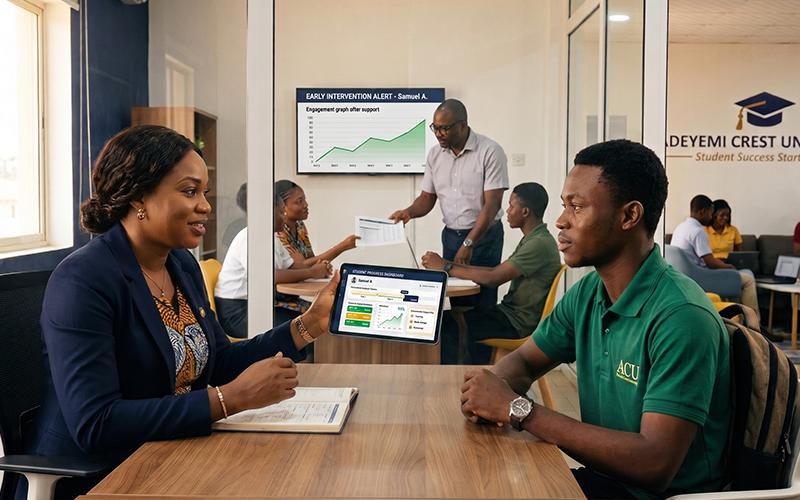
The near future is being shaped by artificial intelligence layered on the descriptive and predictive foundations already in place. Expect predictive intervention to become more granular, with alerts generated in real time rather than at the end of a reporting cycle, and dashboards moving from static termly reports towards live, continuously updated views. Personalised learning recommendations, similar in principle to how streaming platforms suggest content, are beginning to appear in academic settings, tailoring resources or pacing to an individual student’s progress. Some institutions are also experimenting with “digital twins” of academic programmes, simulated models used to test curriculum changes before rolling them out to real cohorts. UNESCO’s guidance on data governance in education is a useful reminder that transparency must scale alongside these capabilities.
Universities do not need more data; most already collect far more than they meaningfully use. What they need is the discipline to connect existing systems, the judgement to identify indicators that genuinely predict student risk, and the follow-through to act on those signals in time. That is the real promise of learning analytics in higher education: not a more impressive dashboard, but a university that notices a struggling student in week four instead of week fourteen.
Vigilearn was built around exactly this problem. By connecting Ediify LMS and Enroli SIS into a single institutional ecosystem, we help universities move from fragmented reporting to genuine academic intelligence, supporting admissions, enrolment, teaching and student support as one connected whole.
If your institution is ready to turn student data into a measurable advantage, book a Learning Analytics Strategy Session with Vigilearn and see how Ediify LMS and Enroli SIS can support your students from first application to graduation. Explore more on the Vigilearn blog or visit vigilearn.com to learn about the full platform.
Frequently Asked Questions
What is learning analytics? The measurement, collection and analysis of data about students and their learning environments, used to understand and improve academic outcomes.
How does predictive analytics help universities? It flags students at risk of underperforming or withdrawing well before problems show up in traditional reporting, giving advisers time to intervene.
Which student data should institutions monitor? At minimum: enrolment status, attendance, assessment performance, LMS engagement and satisfaction feedback, ideally from an integrated SIS and LMS.
Can analytics improve retention? Yes. Institutions combining early-warning analytics with timely, human-led intervention consistently see measurable retention and graduation gains, as Georgia State’s long-running programme demonstrates.
How does an LMS support learning analytics? An LMS such as Ediify LMS captures the behavioural data, logins, submissions, engagement, that forms the early-warning layer of any learning analytics strategy.